Interested in how we do and what we do? This is the place to find out more.
If you have any questions, don't hesitate to contact us
Yield Measurements
All yield measurements are performed with a grain cart scale. We harvest our rep and then unload into the cart while remaining stationary on level ground. We DO NOT use yield monitors to measure our yields because we feel they are not accurate enough; even well calibrated yield monitors can exhibit unacceptable pass to pass variance depending on crop and conditions. This is not always the case of course, but we do not want to take any chances. Scales are simply more precise and consistent, which is what one wants when trying to detect small treatment effects.
Plant Counts
When performing plant counts we take five measurements per rep. We use a three foot long marker that is randomly tossed in the air as we walk across the field; counts are done on the row closest to where the marker lands. Our row spacing is 12 inches, so each count gives us a number for three square feet. The initial count is divided by three to come up with a square foot value. The plant count number included in our trial data for each treatment is an average of five counts performed in each rep.
Experimental Design
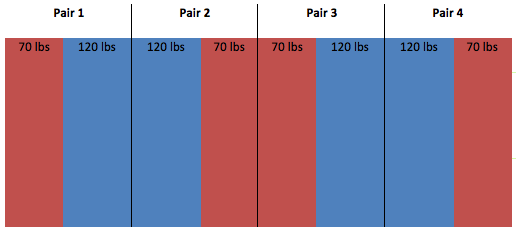
We use two different types of experimental designs in our trials. In the trials that only involve two treatments we use a replicated strip trial. In most cases our two treatment trials get replicated four times, so we end up with four side by side trials in a field; each side by side is considered a pair. We analyze the data in our replicated strip trial with a paired-t test; we consider the yields to be significantly different if our calculated p-value is 0.10 or less. With a p-value of 0.10 it could be said that there is either a 10% chance that what has occurred is a result of random chance, or conversely that there is a 90% chance that what has occurred is a result of the treatment applied.
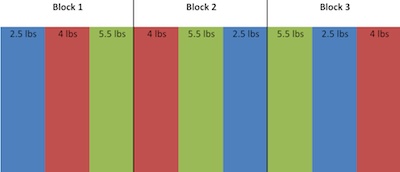
In trials involving more than two treatments we use a randomized complete block design (RCBD). This involves setting up blocks within a field, which contain the treatments randomly assigned to each plot within a block. Each block has all of the trial treatments in it. We use a statistical software program called SAS to perform an ANOVA on these trials; included in the ANOVA test is an LSD test which is used to determine if there is a statistical difference between individual treatments in the trial.
Equipment
*All Equipment uses RTK For Guidance

Economic Analysis
When we perform the economic analysis for our trials we DO NOT use the observed yield values if the yields between treatments are not significantly different. In cases like this, we simply pick one of the observed yields and apply that to both treatments, so in effect the only difference from an economic perspective becomes the treatment cost and any associated application cost. If the difference in yield between treatments is significant then naturally we use the observed yield numbers in our calculations; so in our analysis we would then take (yield x price) – (treatment cost) for each treatment in the trial.
| Treated | Untreated | |
|---|---|---|
| Yield (bu/ac) | 91.0 | 90.7 |
| Price ($/bu) | $7.00 | $7.00 |
| Treatment Cost ($/ac) | $5.00 | No Cost |
| Gross Revenue ($/ac) | $632.00 | $637.00 |
| Net Difference ($/ac) | -$5.00 |
| Treated | Untreated | |
|---|---|---|
| Yield (bu/ac) | 63.9 | 61.3 |
| Price ($/bu) | $11.00 | $11.00 |
| Treatment Cost ($/ac) | $20.00 | No Cost |
| Gross Revenue ($/ac) | $702.90 | $654.30 |
| Net Difference ($/ac) | -$48.60 |